Are Wikipedia users satisfied?

Long story short, yes, they are.
But how we discovered it? Does it hold also during fundraising campaigns periods? And also when the system is affected by network-related events allegedly impacting the site performance?
The Web is one of the most successful Internet application. It is no surprise, then, that QoE directly affects end-users’ willingness to visit a webpage as well as content providers’ business revenues.
Yet, the quality of Web users’ experience is still largely impenetrable.
Whereas Web performances are typically gathered with controlled experiments, here we perform a large-scale study of Wikipedia Quality-Of-Experience (QoE) explicitly asking (a small fraction of its) users for feedback on their browsing experience. The analysis of the collected users’ feedback reveals both expected and surprising findings.
1. Quality-Of-Experience matters
Since its inception, the World Wide Web has sometimes been dubbed as World Wide “Wait” and for this reason a lot of effort has been devoted to reduce its delays. However, it is still unclear if and by how much a latency reduction translates into a better perceived experience from the user point of view.

This, coupled with the obvious aspect of Web QoE heavily impacting revenues for web-based companies, motivated a proliferation of new metrics proposals and validation studies attempting at better capturing human perception on browsing experience. Hence, it seems clear that enhancing Web QoE is of key concerns for many different stakeholders. Indeed, offering a good QoE, ensuring that users are satisfied of the service provided, is a common goal for browser makers, Internet Service Providers (ISP) and equipment vendors.
The difficulty in capturing users QoE on the Web is the result of the fact that it is affected by several factors, some of them often measurable, like the context (e.g., the location, the age, etc.) or the system (e.g., the network type, the application, the device, etc.), some others more frequently unknown and not trackable, as the user expectations.

2. Measure User Acceptance of Wikipedia
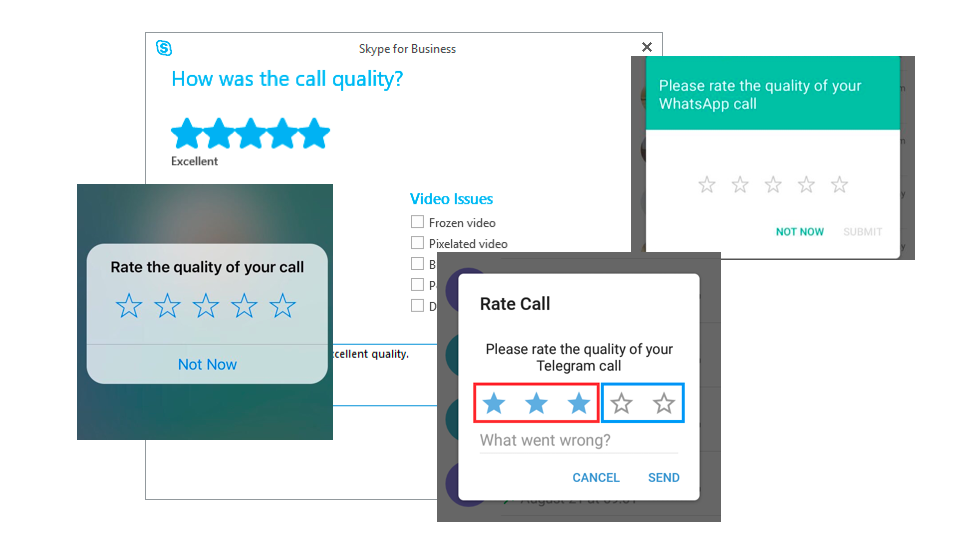
Subjective metrics are gathered by directly collecting responses from users regarding different questions related to Web QoE. Several approaches have been proposed in the literature. Among them, the Mean Opinion Score (MOS) is rather common with VoIP services: Skype, Hangouts often ask for a rating at the end of the call. This approach consists in averaging answers from a set of many users which have been asked to rate on a 5-scale range their QoE.

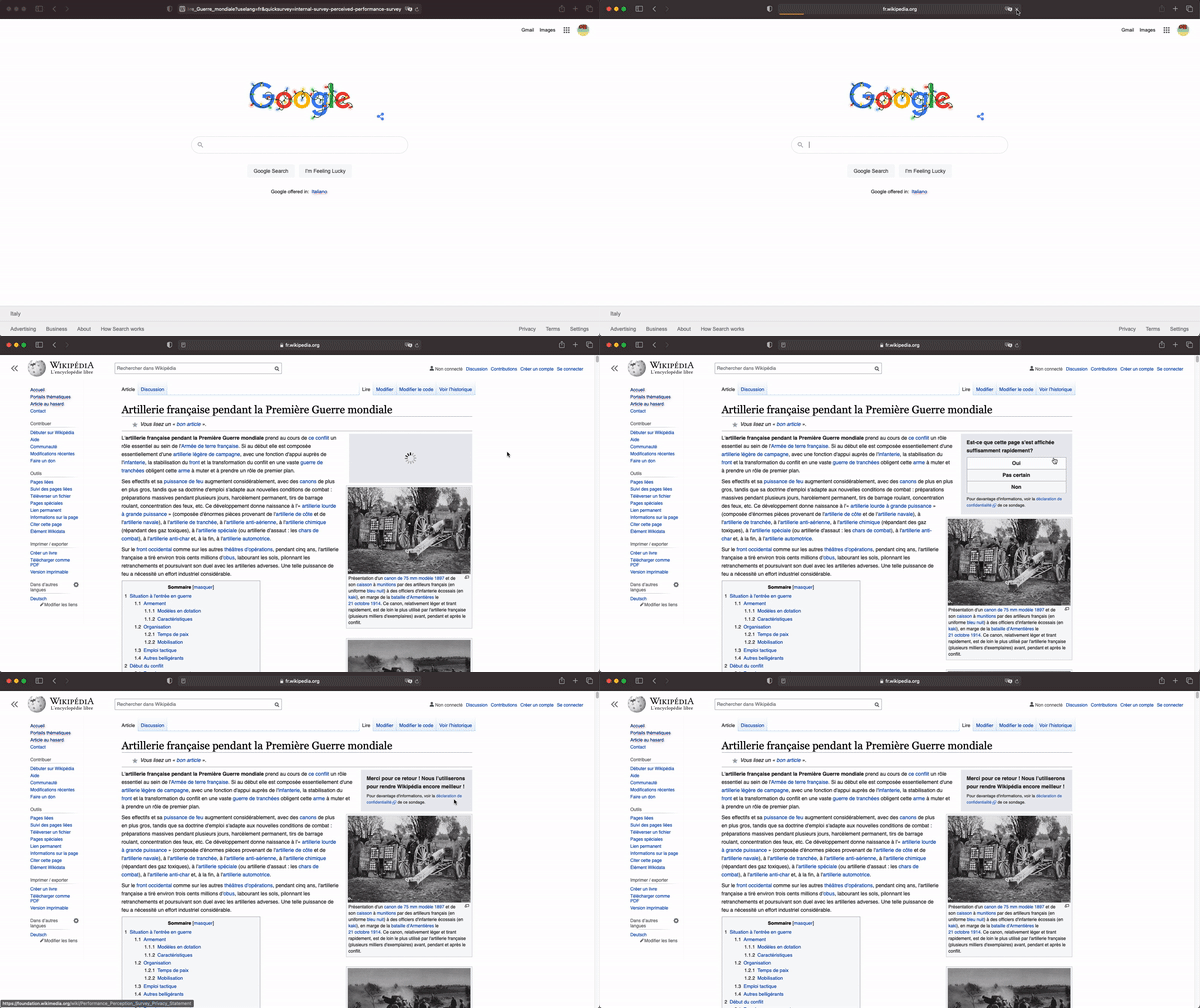
Instead of opting for a 5-grade Absolute Category Ranking (ACR) score, we run a survey which explicitly asks users for their acceptance, i.e., users can respond with a positive, neutral or negative experience. Therefore, we launch a large-scale measurement campaign over Wikipedia, that gathers over 62k survey responses in nearly 5 months.

We complement the collection of user labels with objective metrics concerning the user browsing experience (from the simple page load time to the more sophisticated metrics), and harvest several data sources to further enrich the dataset with several other informations (ranging from technical specification of the user device to techno-economic aspects tied to the user country) so that each user survey answer is associated with over 100 features.
The analysis of the user feedback reveals bsence of seasonality in the answer breakdown. Indeed, the daily fraction of positive, neutral and negative answers remains remarkably steady over the observation period, with a stationary fraction of about 85% satisfied users. By looking at different Wikipedia-related events happening during the same period, e.g., injection of banners for fundraising, data center switchover or browser regression, this result could be somewhat surprising since, one would expect these events to directly affect the objective measurable delay.
Congrats Wikipedia! The service provided is so excellent that users are (almost always) satisfied!

3. User Feedback Prediction: Great Expectations, Big Disappointment
At this point, one could ask a very simple but challenging question: “Can we predict the subjective user feedback based on the objective features collected?” This would be very helpful in the context of QoE monitoring and degradation dection.
So, we leverage user responses to build supervised data-driven models to predict user satisfaction.
Unfortunately, prediction outcome is deceiving despite the relatively large number of features collected, among which state-of-the art quality of experience metrics. We also consider how the classification results change when we slice the dataset by keeping only subsets of them and observe a still very limited improvement.
Moreover, there exist other QoE influence factors that we did not include in this study, like the sentiment linked to the topic and the content of the page or more information about the context in which the measurement is carried out, as the earlier user browsing experience. These undoubtedly have an important impact, that is however hard to capture in the experiment we carry on!
 Want to know more? Read our papers!
Publications
Salutari, Flavia, Da Hora, Diego, Dubuc, Gilles, & Rossi, Dario, A large-scale study of Wikipedia users’ quality of experience, The Web Conference (WWW’19) May 2019.
Salutari, Flavia, Da Hora, Diego, Dubuc, Gilles, & Rossi, Dario, Analyzing Wikipedia Users’ Perceived Quality Of Experience: A Large-Scale Study, IEEE Transactions on Network and Service Management, 2020.